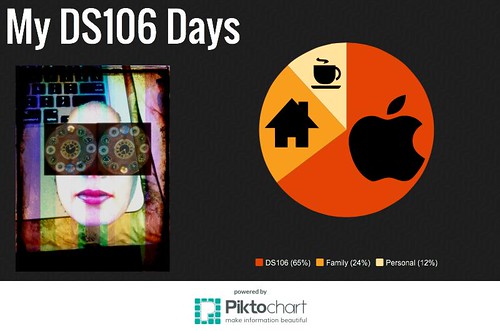
For this week’s DS106 Design assignment I chose to create an infographic life. I graphically represented how I distribute my daily time each day during this course. I estimated that my daily activities usually take 16 hours and calculated the percentage I usually spend developing UC Denver ds106’s different tasks, having family working time, and relaxing personal time. I enjoyed visualizing it because I am loving everything I am doing in this moment despite physical and emotional challenges.
To create the infographic I took pictures with my iPhone and modified them using Photoshop App and Online Editor Pixlr Express. I made the infographic in Piktochart combining my images with the graphics the site provides.

Leave a comment